

Latest EPA data confirms that air quality progress has stalled, and in some cases is reversing
Latest EPA data confirms that air quality progress has stalled, and in some cases is reversing
The EPA released official 2021 trend data this week

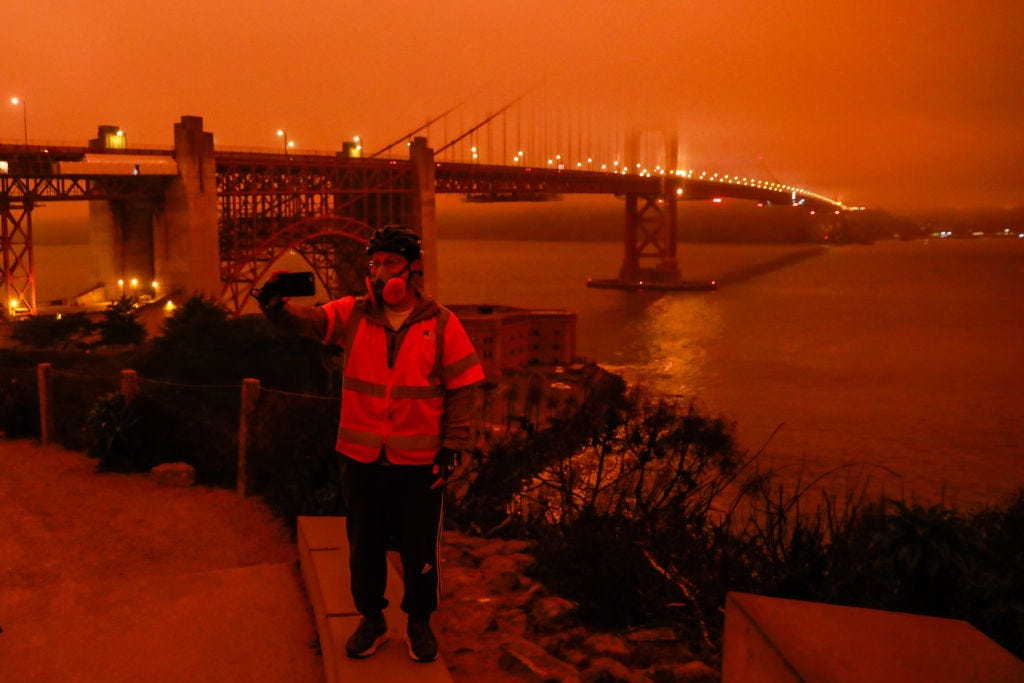
Ambient levels of a pollutant responsible for tens of thousands of annual deaths in the United States have increased by 12 percent in the past two years, according to new data released on June 1 by the U.S. Environmental Protection Agency. Much if not all of that increase can be attributed to an especially busy wildfire season which flooded parts of the country with noxious smoke for weeks at a time.
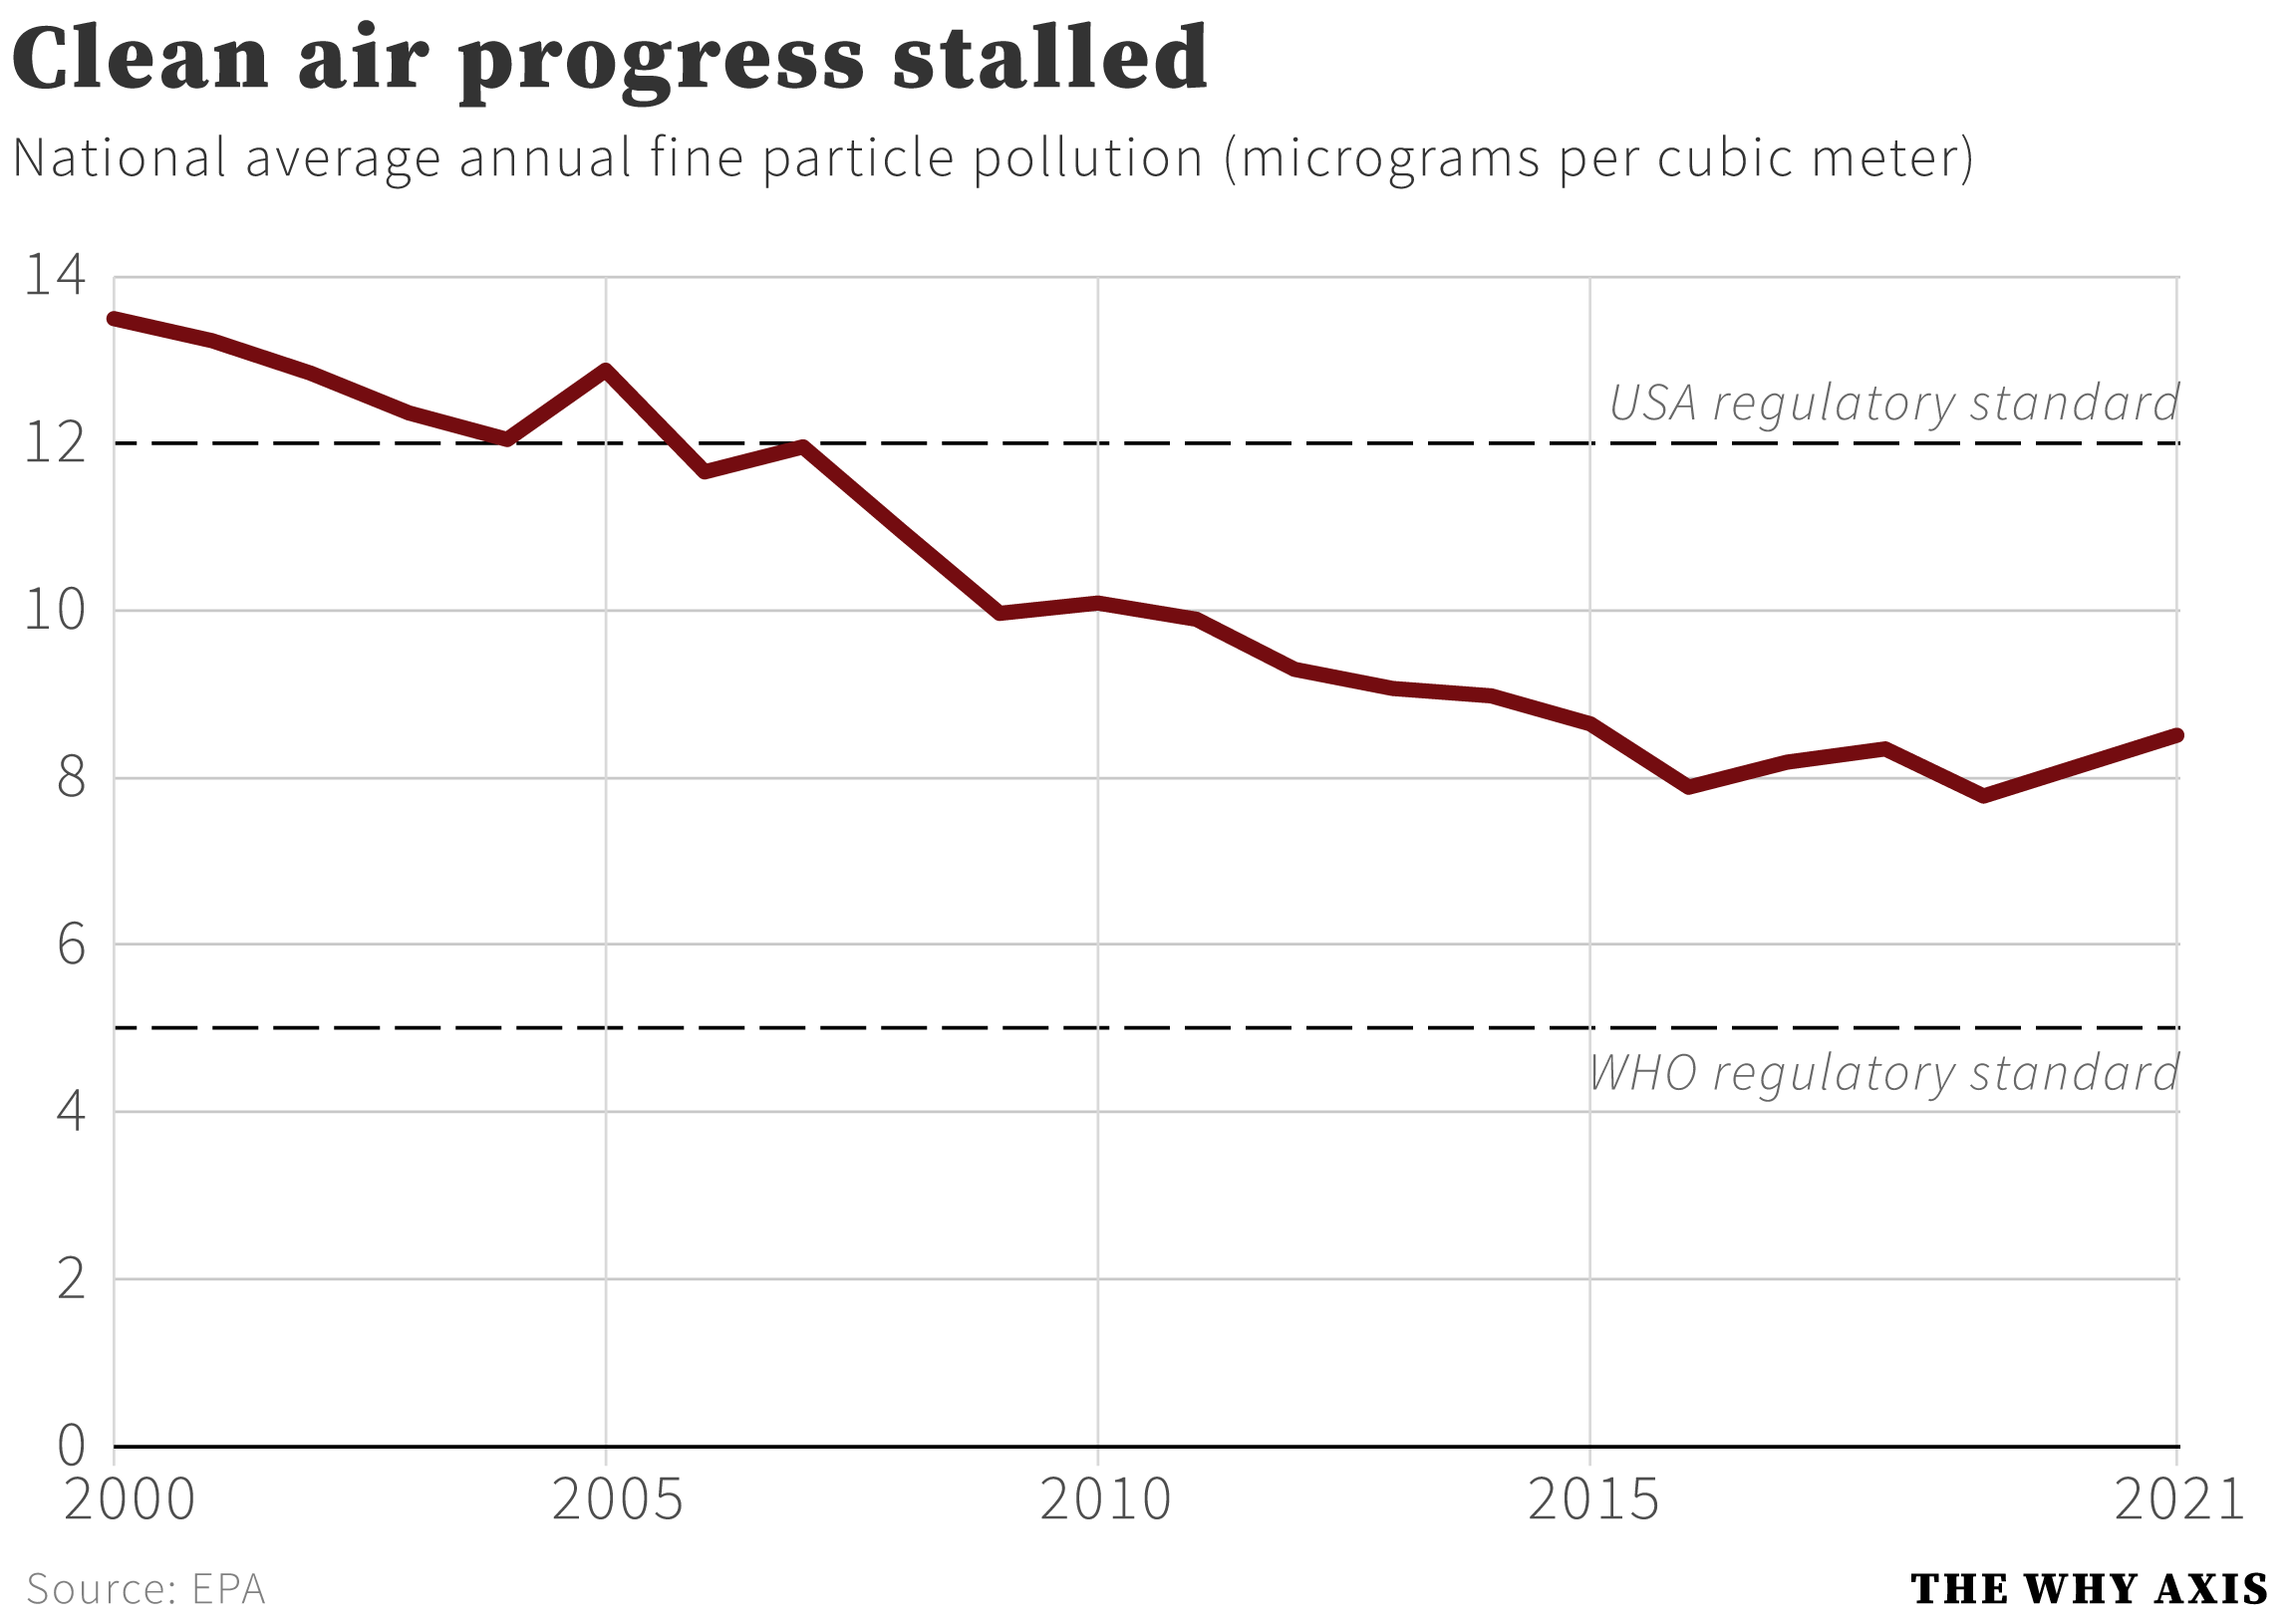
The national average level of the pollutant, known as PM2.5, stood at 8.5 micrograms per cubic meter (µg/m³) in 2021. That’s below the EPA’s regulatory threshold of 12 µg/m³, but well above the World Health Organization guideline of 5 µg/m³. Data published by private companies monitoring air quality has shown a similar year-over-year trend.
Researchers have found that the harmful health effects of the pollutant — which is a byproduct of fossil fuel combustion, industrial processes and natural events like wildfires — kick in at ambient levels well below current regulatory guidelines.
In 2021, the worst air in the country was located, as usual, in California’s Central Valley. Monitors in Bakersfield and Visalia recorded annual average PM2.5 readings exceeding 20 µg/m³ — four times the WHO’s recommendation. PM2.5 in the city of Bakersfield exceeded the EPA limit on two thirds of the days of the year. For nearly 70 days last year, the air was rated “unhealthy” for sensitive groups like children and seniors, and on 14 days it was simply unhealthy for everyone.
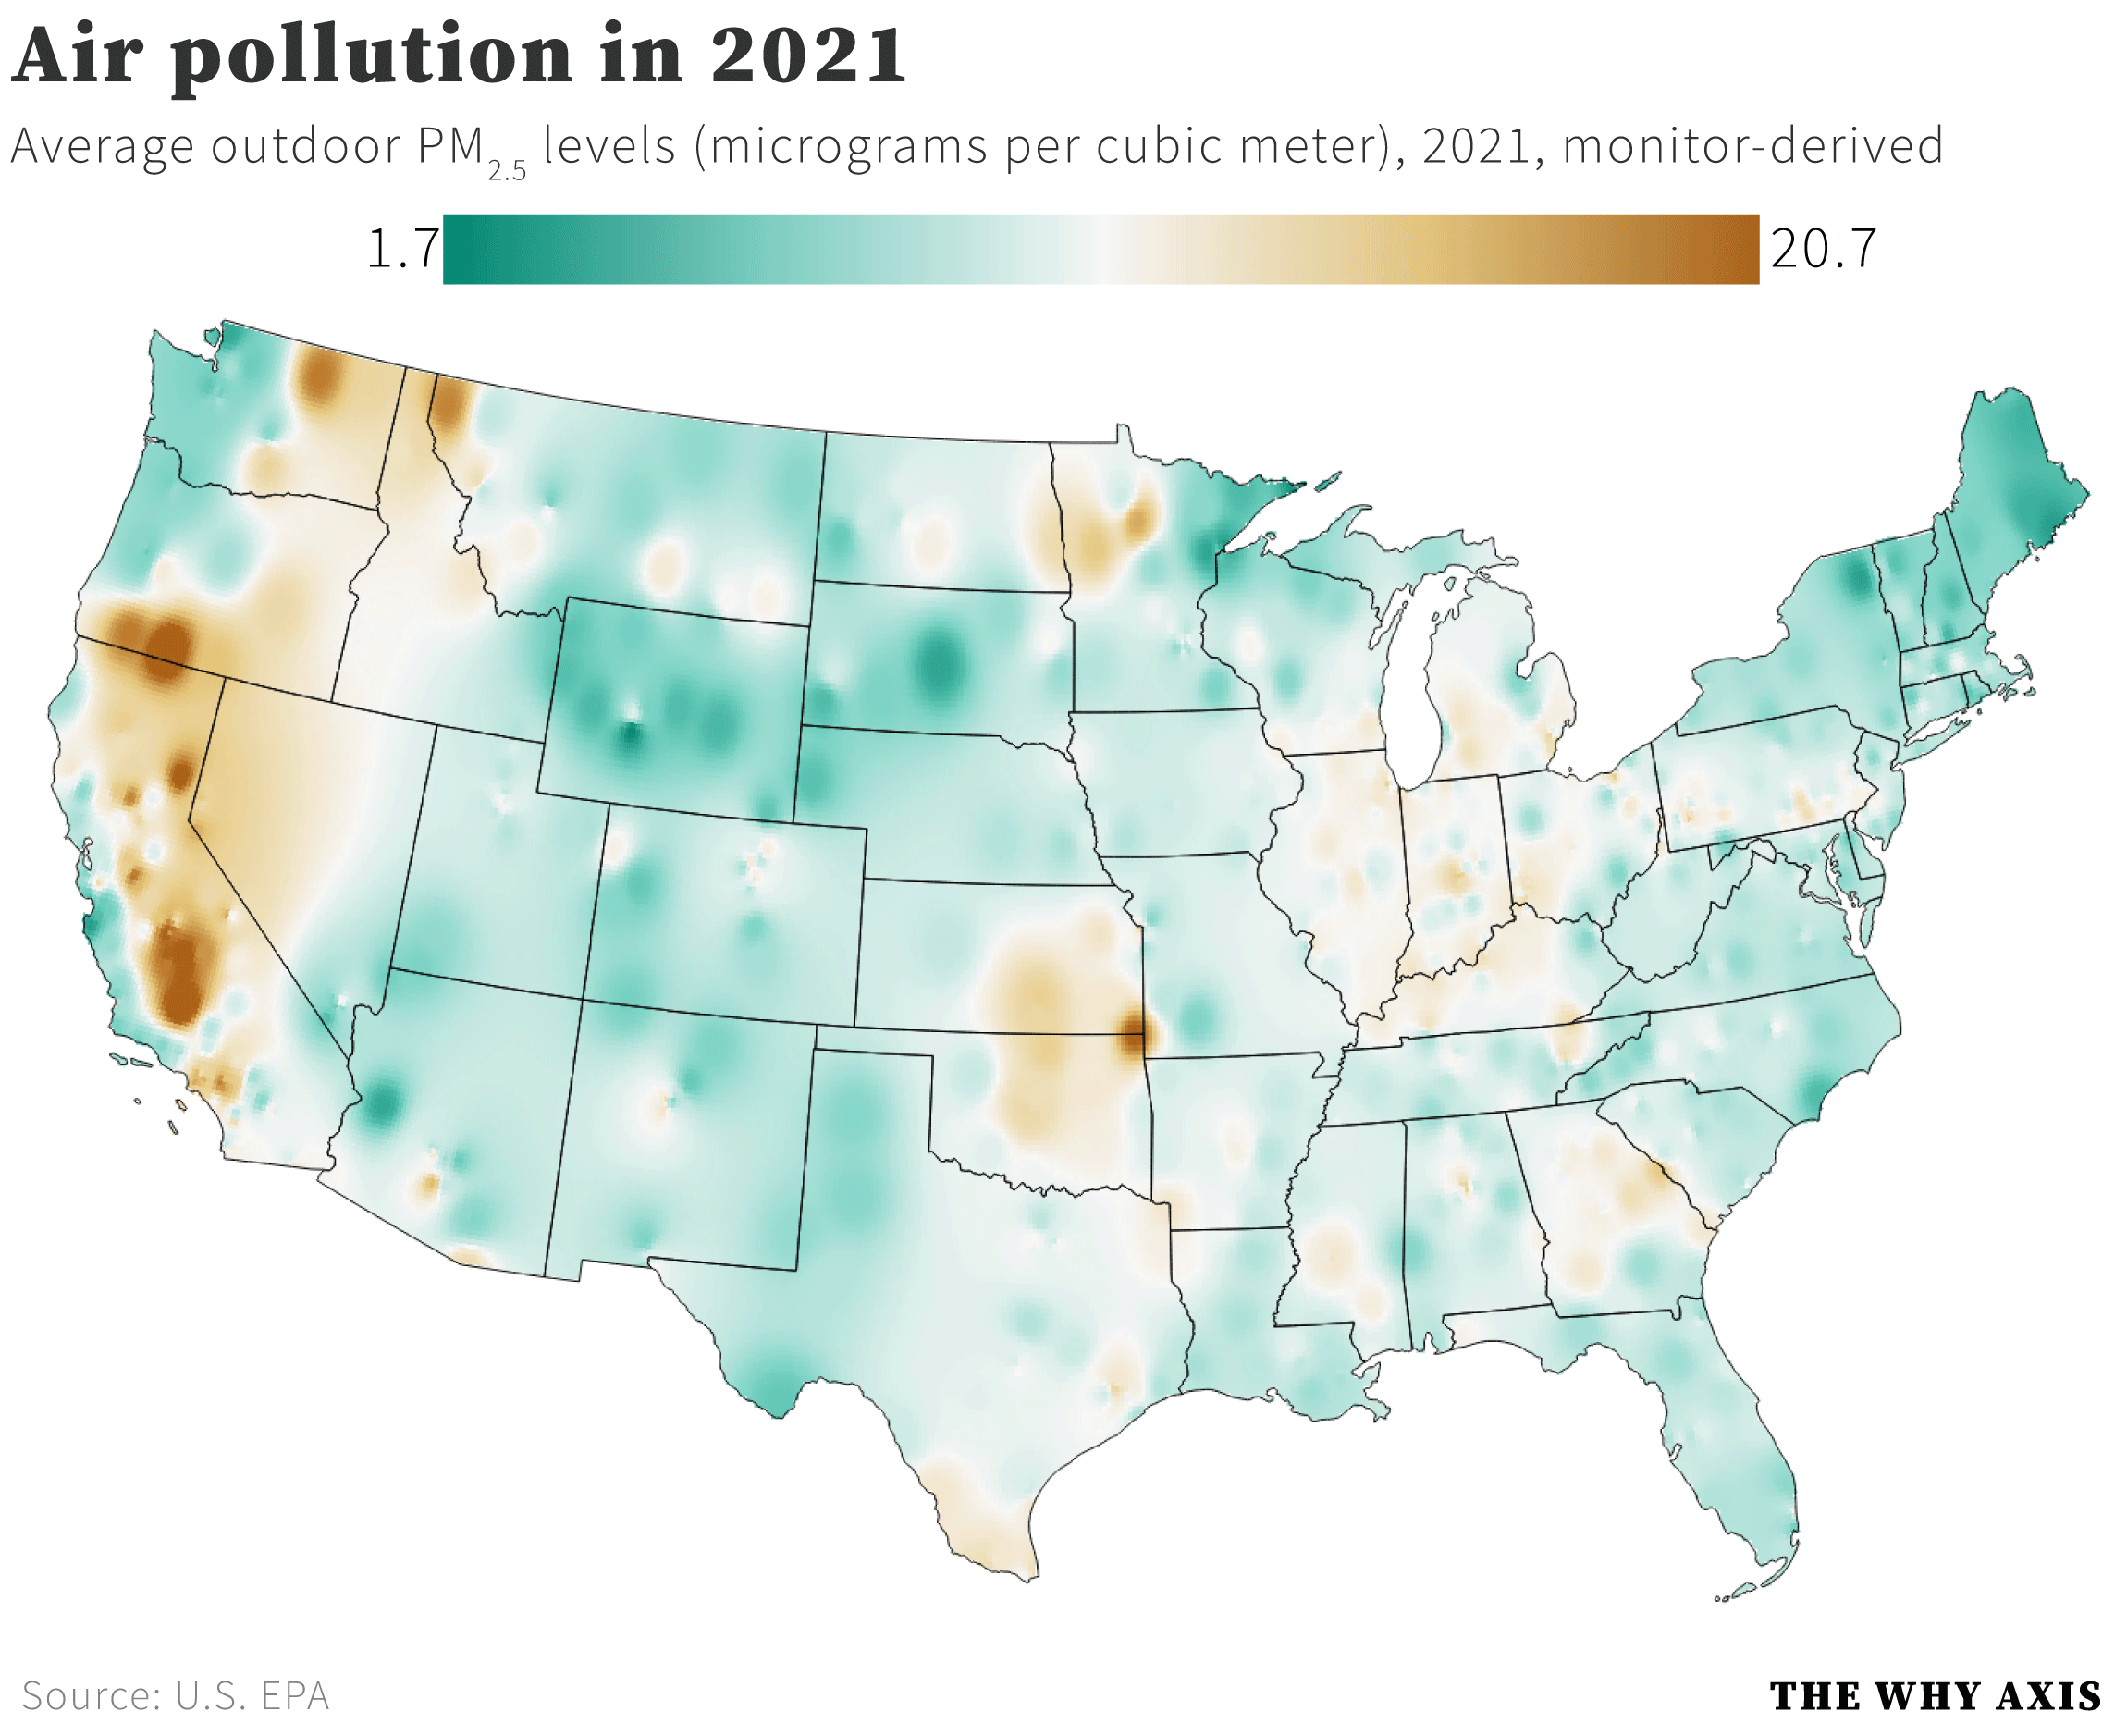
A note on this map — it’s displaying annual readings posted by about 900 air quality monitors tracked by the EPA. Those monitors produce readings at discrete geographic points, so for mapping purposes I’ve interpolated values for the regions in between monitors. This will naturally lead to some imprecision — it’s quite likely that on-the-ground conditions in some of the interpolated spaces are different than the numbers the algorithm spits out. But I think overall this does a better job of conveying the national air quality picture than a bunch of colored dots with a whole lot of white space in between.
California’s Central Valley accounted for eight of the top ten highest PM2.5 averages in 2021. The other two were located in Klamath Falls, Oregon and Miami, Oklahoma (yes, that’s a real place). All posted annual readings above 15 µg/m³, or three times the WHO limit.
On the flipside, the cleanest air in 2021 was in Hawaii, the only state in the union where all EPA monitors showed annual PM2.5 levels below the WHO guideline. Parts of Wyoming and Duluth, MN rounded out the top 10.
Overall, of the 900 EPA monitors with annual average data for 2021, just 40 came in below the WHO threshold. Conversely, 45 monitors posted readings above the already-lax 12 microgram EPA guideline.
The United States emitted about 1.4 million tons of PM2.5 from human activity, according to the EPA. That number is virtually unchanged since 2018, suggesting that “natural” sources like wildfires are behind much of the recent increase. That increased wildfire activity, on the other hand, is in large part due to human-driven climate change.
The EPA doesn’t really like to focus on these year-over-year changes. In their report and press release they emphasize the long-term, decadal trends. That makes sense on some level, because those trends show massive declines. The air today is much, much cleaner than it was 20 or 30 years ago. It’s a huge regulatory success story.
But our understanding of these pollutants has evolved in recent years, particularly the growing expert consensus that the stuff is doing real, measurable harm to us at levels previously thought safe. In the case of PM2.5 it’s shaving months, even years off our lifespans — good years too, not just the ones when we’re infirm and frail. In that context, the year-over-year fluctuations matter, particularly for the millions of people living in areas where the air is badly polluted.
The EPA is facing many challenges at the moment. Successive Republican presidential administrations have starved it of needed resources, and Democratic presidents have been limited in their ability to undo the damage. Unfortunately, one area where it’s scaling back its efforts is air pollution. In 2022 “the agency suspended monitoring for ammonia, sulfur and other pollutants at more than two dozen places across the country, citing budget constraints,” the Washington Post reported. At a time when we’re learning more and more about the harm caused by air pollution even at levels previously thought ‘safe,’ that’s a mistake.