

How to torture data
How to torture data
Lessons from the 202nd retracted Covid paper


Back in March, researchers published a peer-reviewed analysis of Covid lockdowns that caused quite a stir: comparing cell phone-derived data on mobility with official Covid death statistics across hundreds of countries, the paper purported to show that government-mandated lockdowns had absolutely no impact on Covid severity.
The findings were championed by conservative critics of Covid restrictions, including the Trumpist physicians’ group promoting quack Covid treatments, far-right radio hosts and conservative op-ed pages.
This week the journal editors formally retracted the paper, against the wishes of the authors, for crippling methodological errors: specifically, the authors galaxy-brained themselves into using a highly convoluted mathematical model that, in the end, always output the same conclusion regardless of the data fed into it. I’m going to briefly walk you through what happened here (in a totally non-technical way!) because it’s a great education in how the scientific process works, how it can go wrong, and how good intentions can lead to bad data.
The study dealt with the relationship between two variables: the share of people staying at home in a given country during a given time period, and the rate of Covid mortality there. This is pretty basic social science stuff: are these two variables related and, if so, is one of the variables causing changes in the other? Statisticians have a whole bunch of tools to answer these questions. At the risk of over-simplifying: They can attempt to correct for confounding factors, like demographic differences, that might be influencing both variables. They can shift time series forward or backward in order to better account for delayed responses. They can transform the data — for instance, by rendering it on a logarithmic scale — to tease out subtle differences that may not be apparent otherwise. They can also do lots of other things that, quite frankly, I don’t understand.
But the authors of this paper didn’t do any of those familiar things. Instead, they decided to do something completely different. Here’s how it’s described by Raphael Wimmer, an academic computer scientist who was among the first to raise concerns about the paper after publication:
[The authors] developed a custom approach for finding out whether there was an association between mobility and mortality: For each country, they calculate the derivative of both time series, then take pairs of countries (A,B), subtract the time series of A from those of, B and check for a statistically significant correlation between those two differences.
Go ahead and read that again if you have to — it doesn’t make much sense to me either.
Nobody seems to understand why the authors opted for this Rube Goldberg-esque “correlations between the differences of the derivatives of the time series” approach to the data. But fortunately, the authors made all of their data and code public, which allowed others to kind of kick the tires of their model and see what was really going on under there.
As it turns out, the answer is “not a whole lot.”
Wimmer, along with epidemiologist Gideon Myerowitz-Katz and other collaborators, began plugging other datasets into the authors’ complicated model. First, they generated some artificial datasets showing massive and quite obvious relationships between stay-at-home behavior and mortality: hypothetical places where deaths plummeted shortly after the implementation of lockdowns, or where they spiked after lifting lockdowns, or where they rose steadily with no lockdowns in place at all.
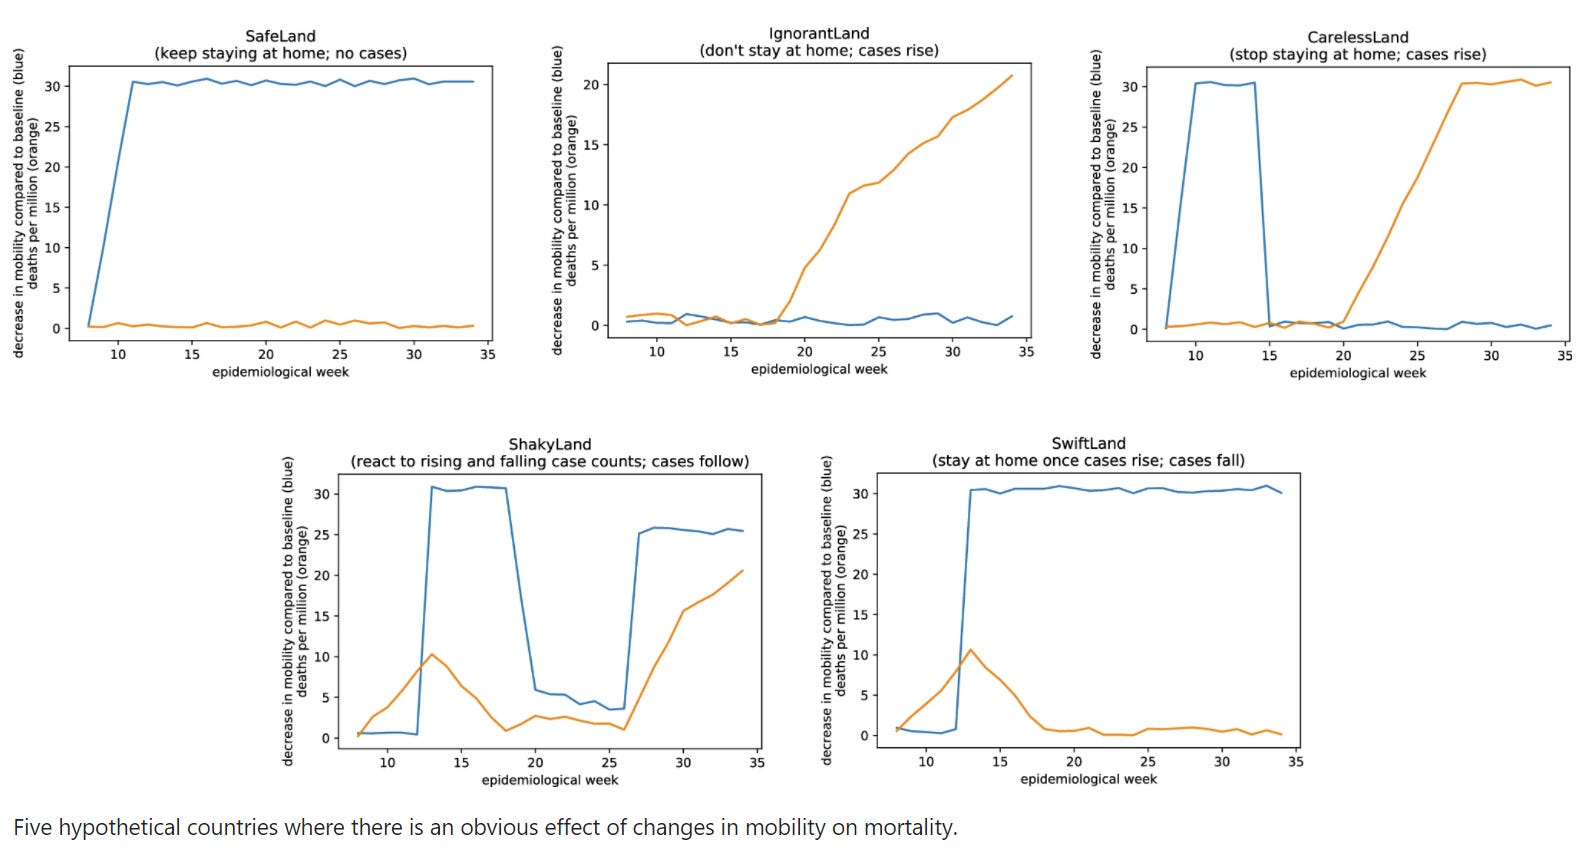
The model spit out the same conclusion for each dataset: no relationship whatsoever.
Then they started futzing with the original data. For instance, in some cases they offset the time series so that policy changes immediately preceded changes in mortality. Again: no relationship, according to the model.
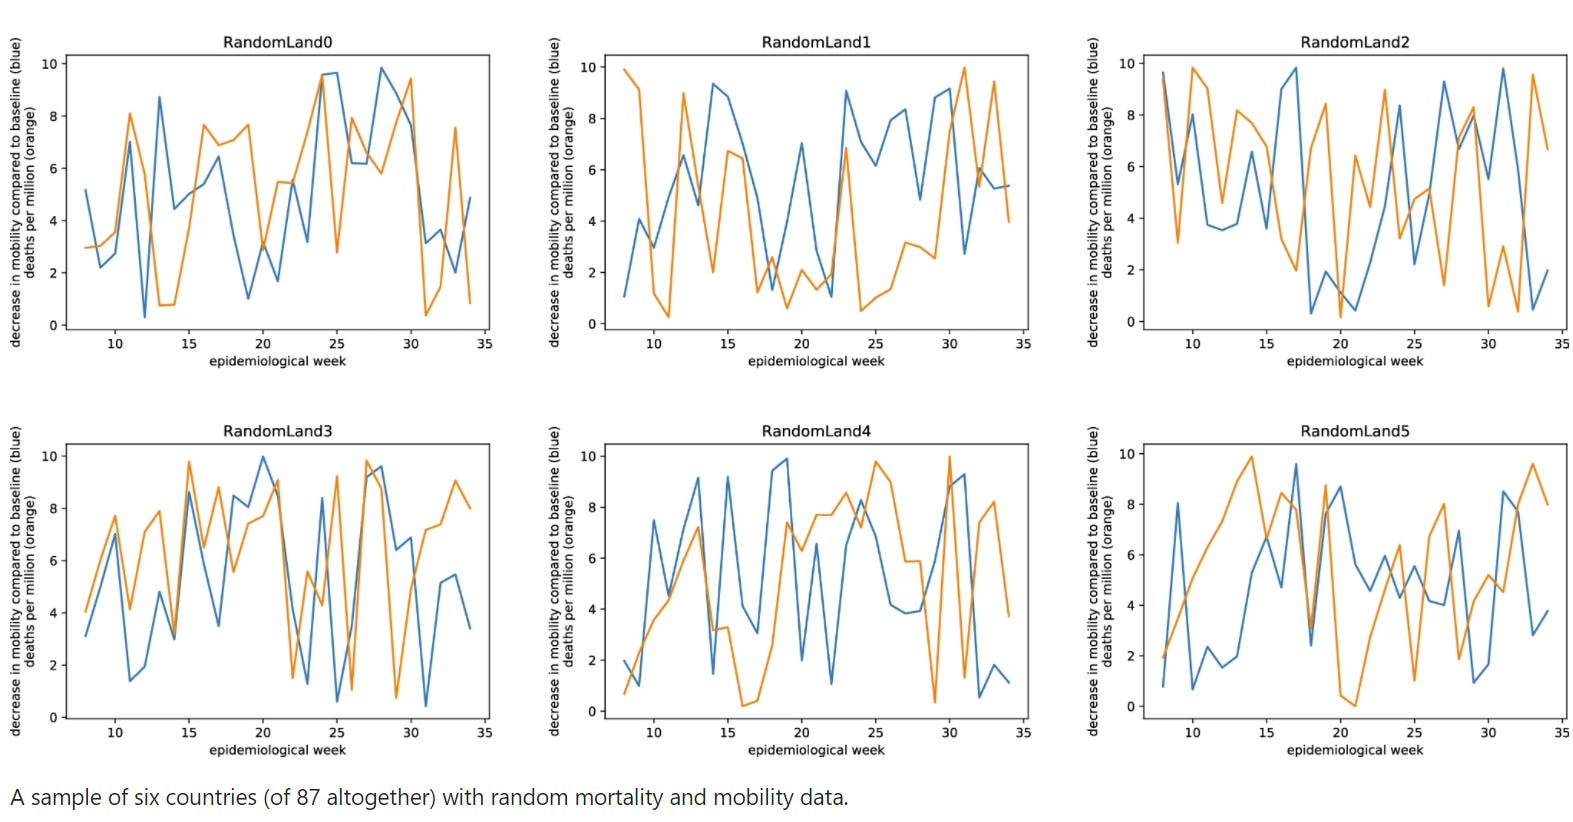
Then, they simply plugged a whole bunch of random numbers into the model — literal noise. Hilariously, the model was more likely to assign significance to those completely random relationships.
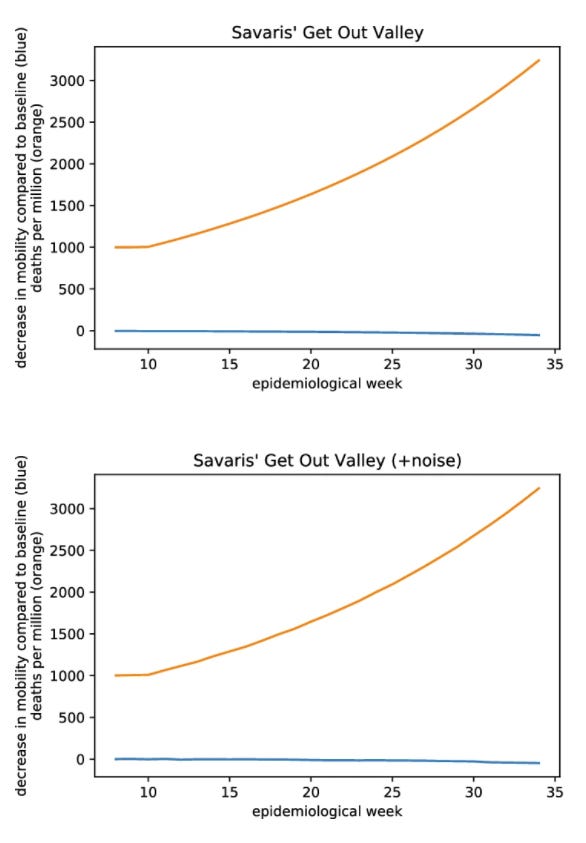
Finally they reached out to the authors: could they maybe supply some data where the model would correctly identify a clear significant relationship? To their credit, the authors obliged and sent some hypothetical data where they model did what you’d expect it to.
But then, Meyerowitz-Katz and his colleagues did something really sneaky: they applied a tiny bit of random noise to the data. If a value was “2,” for instance, they’d randomly change it to something like “2.0003” or “1.997.” Changes so tiny you can’t even see them in the chart below, and which shouldn’t affect any sane assessment of the data’s significance. But shockingly, these changes totally reversed the computer model’s ruling, causing it to pronounce the the relationship non-significant.
“To us,” Meyerowitz-Katz and his colleagues write, “the outcomes of these experiments indicate that the proposed method (a) cannot reliably detect an effect of mobility on mortality even if it should exist, (b) cannot distinguish meaningful data from random data, and (c) is highly susceptible to noise in the data.”
They conclude with the understatement of the year: “Overall, this seems to make the approach unsuitable for the task at hand.”
They weren’t the only ones documenting massive issues with the paper’s methodology. A mathematician at the University of California published the results of his own experiments with the model, proving that it is definitionally incapable of producing anything but random noise.
All this was too much for the journal’s editors, who pulled the plug on the lockdown paper on December 14.
It’s tempting to ask how something like this would even get published in the first place — this is precisely the sort of thing that the peer review process is supposed to prevent in the first place. But the reviewers missed this — a giant, sucking void in the methodology section that outside observers picked up on almost immediately. I’m not sure why that is.
Often, in statistical work, you have to manipulate your data a bit — do things to tease out important differences that may be hard to see otherwise. But there’s “massaging the data” and then there’s what happened here, which is more like “mugging the data in a dark alley, driving it to an abandoned warehouse, and waterboarding it until it tells you what you want to hear.”
As the watchdog group RetractionWatch notes, that makes this research the 202nd retracted Covid paper so far.
So this is what’s behind my brother’s claim that “the studies show that lockdowns don’t work.” Wow.
Wow. Nicely reported, Chris.