
Getting our drink on
Getting our drink on
What the latest federal data show about American drinking habits

The average American drank the equivalent of nearly 2.4 gallons of pure alcohol in 2019, according to the latest federal data released in April.
“Gallons of pure alcohol per year” is a useful number for academics and regulators but doesn’t mean a whole lot to normal folks who don’t measure their ethanol intake by the jug. Fortunately it’s easy enough to convert the figure to standard drinks — basically the amount of pure alcohol (0.6 ounces, for the curious) in a typical can of beer, glass of wine, or shot of liquor.
So let’s try that first sentence again, this time with human-readable units: “The average American drank a little over 500 alcoholic beverages in 2019, according to a Why Axis analysis of recent federal data.” That works out to roughly one and a half drinks per day for every American over the age of 13.
That number’s on the rise — and bear in mind this is before the pandemic hit (more on that in a bit).
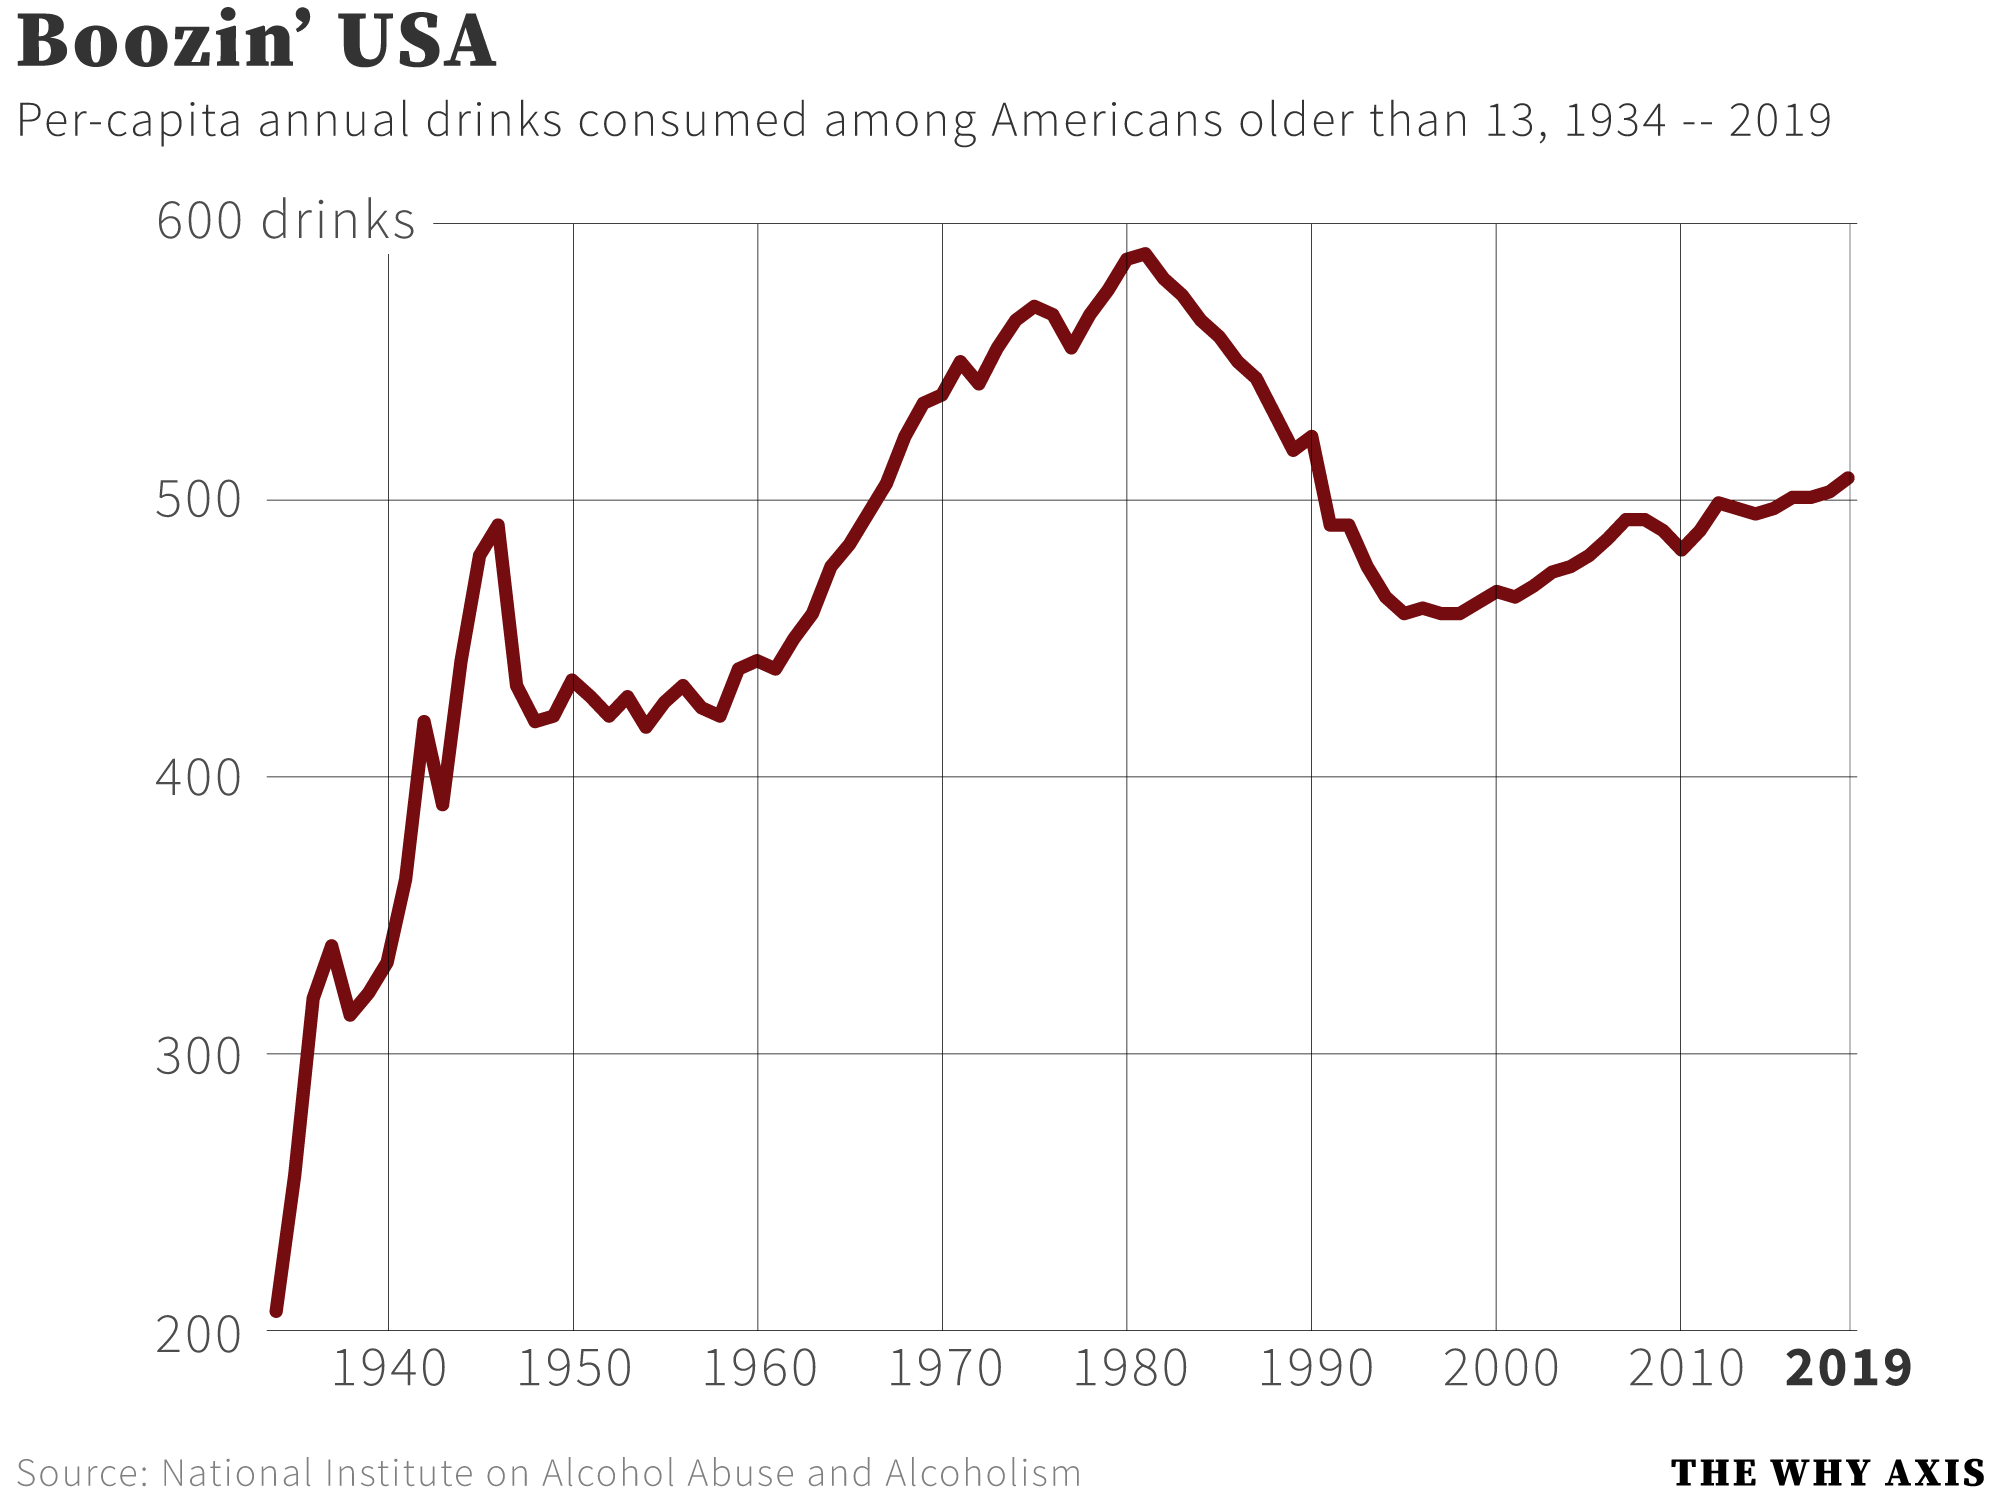
The trajectory of American drinking since Prohibition is an uneven one. There was a big ramp up of consumption in the 1930s and during World War 2, which eventually settled out at around 425 drinks per person per year during the 1950s. Then from 1960 through 1981 drinking rose rapidly, topping out at nearly 600 drinks per year, before falling again by almost as much and bottoming out in the late 1990s. Now we’re on another upswing, although at a slower rate — so far — than the previous drinking boom.
Some of this is probably due to generational effects — the spike in the 60s and 70s corresponds roughly with the Boomers hitting their prime drinking years, which typically happen in your twenties. Many states also lowered their drinking ages during that period, opening up a legal market for younger drinkers. The nationwide minimum of 21 wasn’t set until 1984, corresponding with the start of a long decline in total consumption.
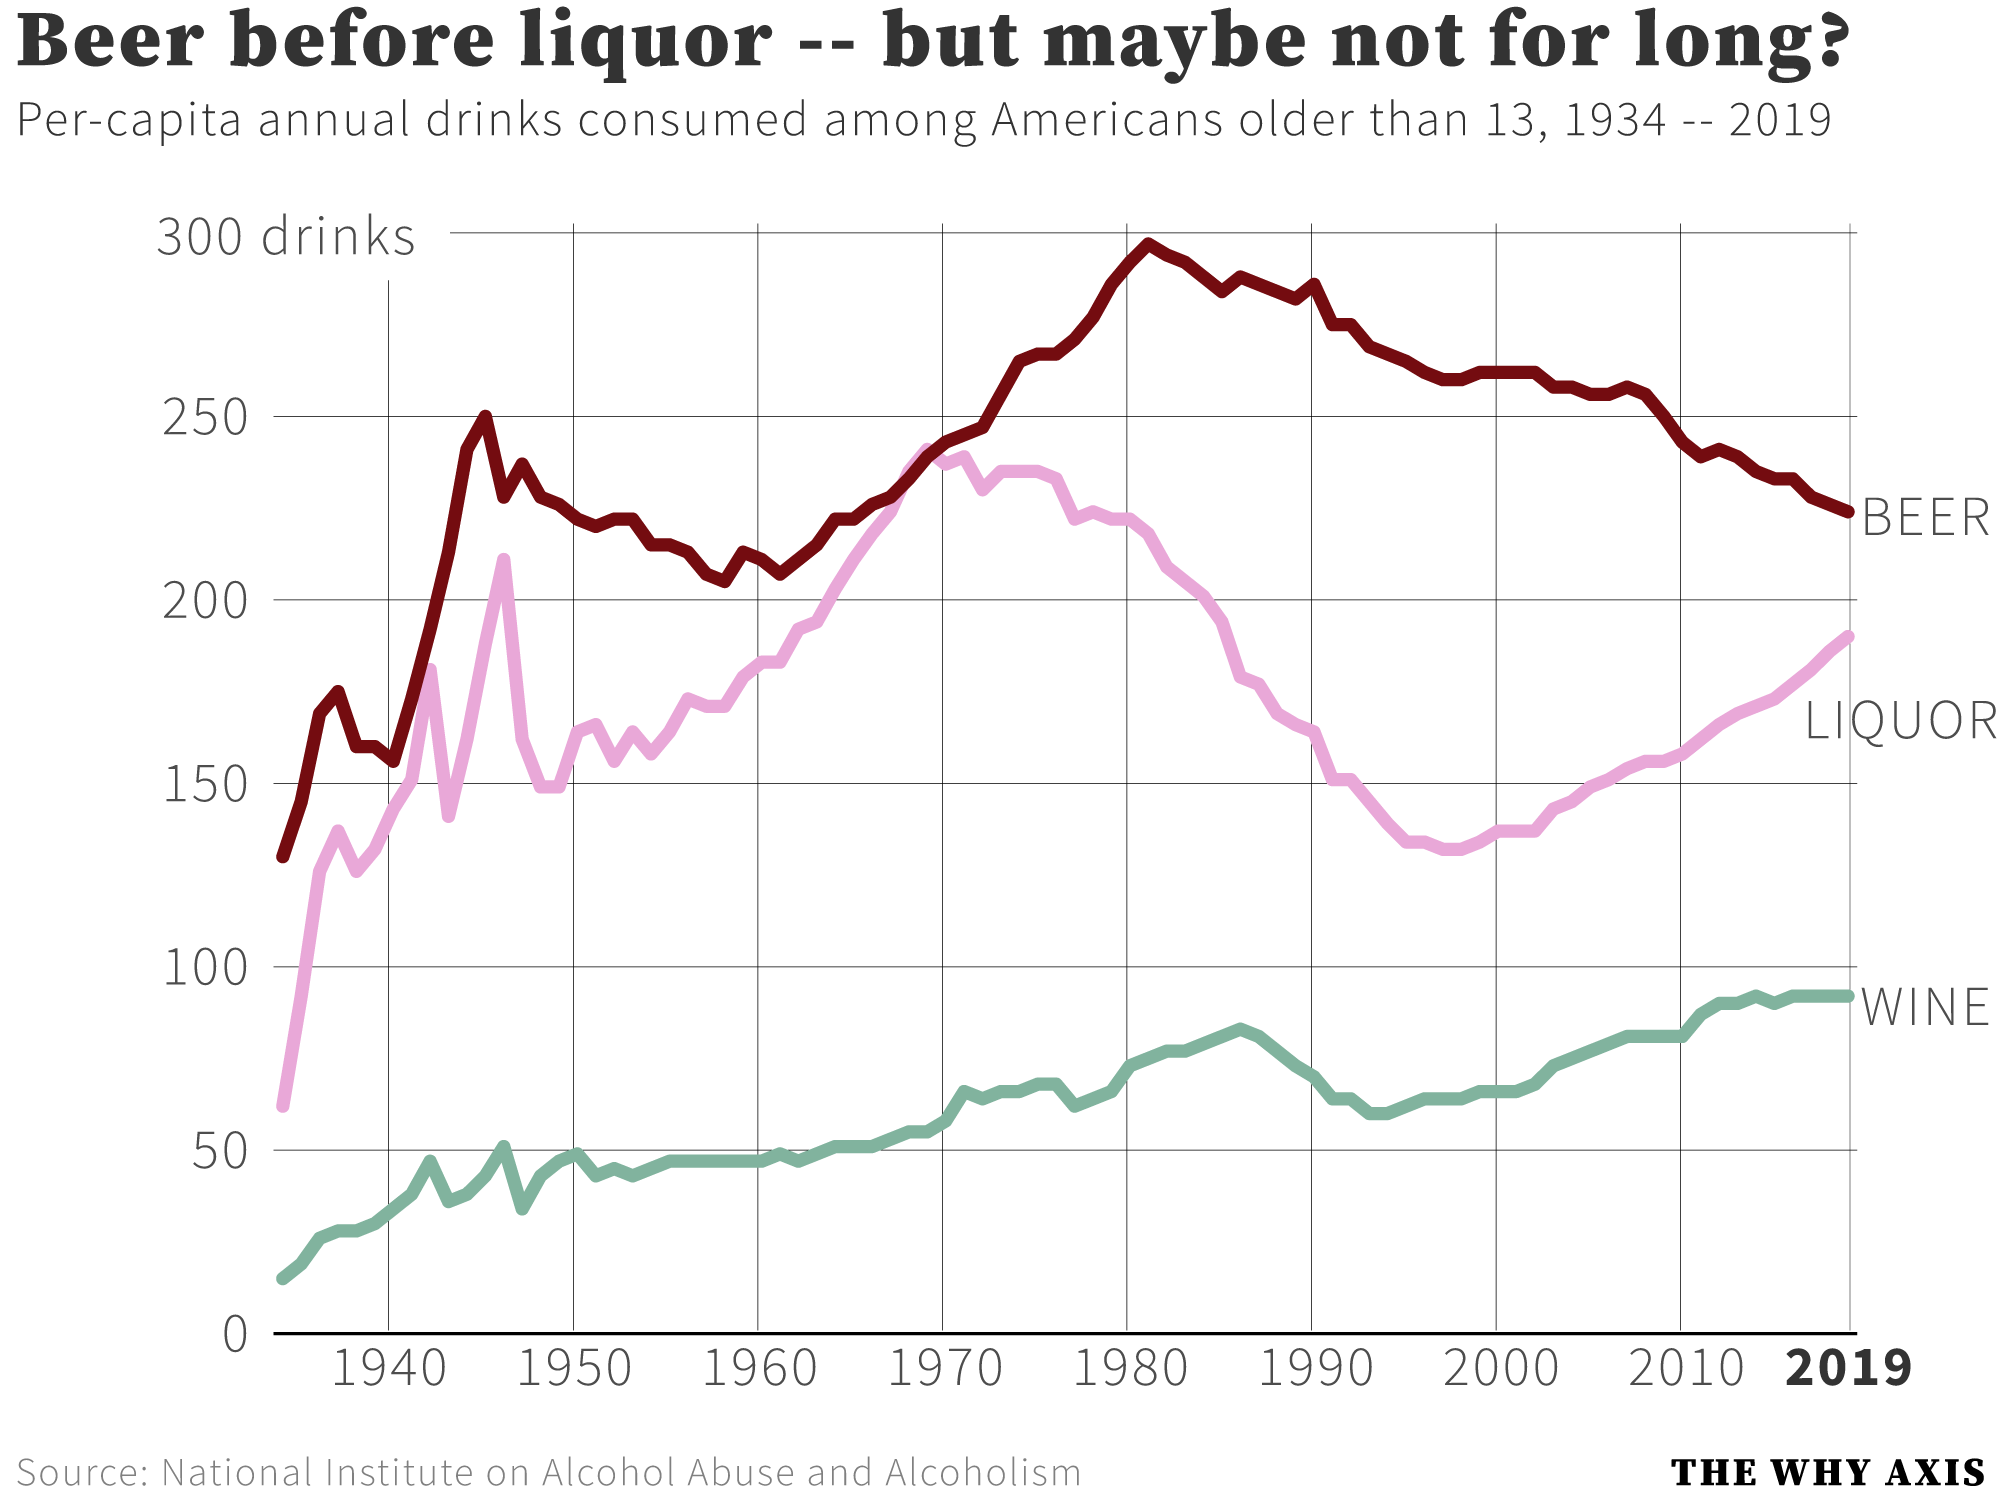
In this month’s issue of the Atlantic, Kate Julian points to a number of possible explanations for the ongoing increase in drinking today: for starters, the spirits industry ended its voluntary ban on television advertising in 1996. It’s probably not a coincidence that hard liquor accounts for the lion’s share of the rise in alcohol consumption since then.
Women are also drinking more than they used to, reflected, Julian notes, in the growing prevalence of alcohol in mom culture. Then there’s the notion, stemming largely from research done in the 1990s and still promoted heavily by the alcohol industry today, that one or two drinks per day is actually good for you (the industry would prefer you ignore newer, more carefully-conducted research showing that once you correct for the fact that many people had to quit drinking precisely because alcohol was wrecking their health, those supposed benefits tend to disappear (rule of thumb: multi-billion dollar industries devoted to making you consume more carcinogens don’t have a great track record of acting in the public’s best interests)).
Finally, some of the increase might be tied to straight-up harder, unhealthier drinking. Recent studies have found that rates of alcohol abuse and dependency have risen since the 1990s. You don’t have to look hard to see a parallel between this rise and the increase in the so-called “deaths of despair” from drug overdoses happening at roughly the same time. The stressors of modern capitalist life appear to be driving growing numbers of us to seek chemical relief at any cost.
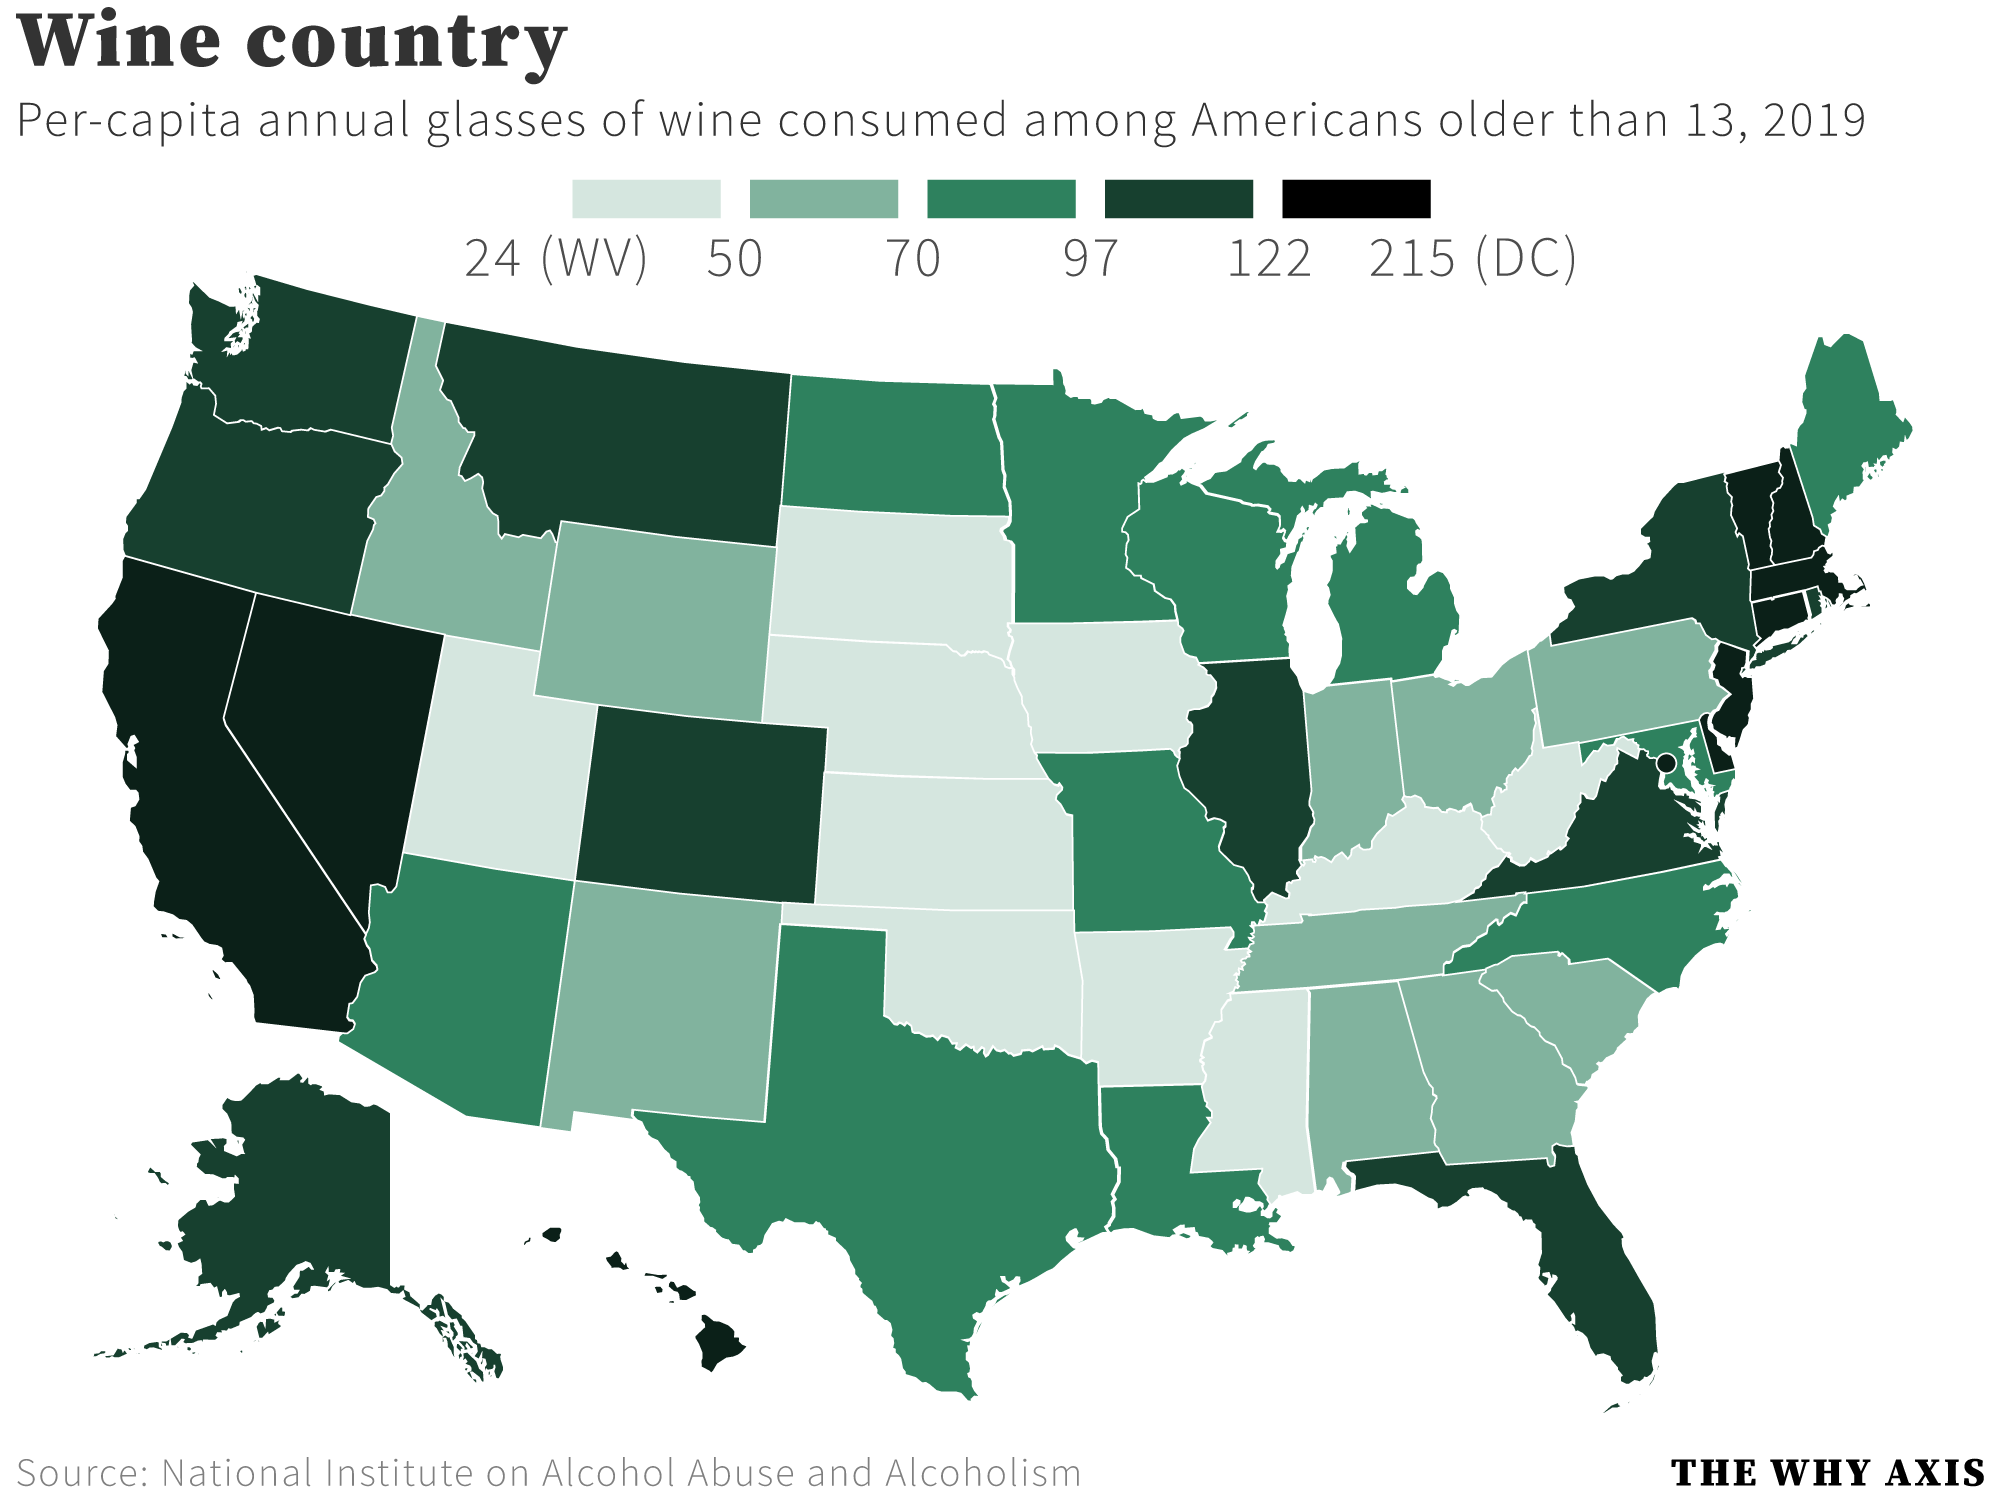
On a somewhat lighter note, here’s what the geography of American drinking looks like: fairly heavy drinking in the northern plains and New England, less so in the deep South and especially Utah.

The leader in per-capita consumption is New Hampshire with a whopping 1,000+ drinks per year, which brings to mind one important caveat: these figures are derived in large part from sales data. In some cases people travel across state lines to buy their booze — we know this is especially true in New Hampshire, due to its complete lack of a state liquor tax and aggressive efforts by the state government (!) to court out-of-state buyers. So some of this state-level variation reflects people buying alcohol in one state but consuming it in another. For that reason, these state-level figures are a little less reliable than the topline national estimates.
The maps for beer and liquor look more or less the same so I’m not going to bother with them, but I want to show you the wine map, which affirms one stereotype about wine-drinking: it’s disproportionately a coastal phenomenon, as attested by the Great American Wine Desert in the middle of the country running from South Dakota all the way down to Mississippi.
There are several other big and exciting caveats that go along with these data, which come from the National Institute on Alcohol Abuse and Alcoholism (NIAAA). For starters, that very agency was embroiled in a massive scandal a few years back when it was conducting a big study to determine, once and for all, whether moderate drinking really is good for you. The problem was that the study’s researchers had tried and largely succeeded to get the alcohol industry to fund most of that research, and had strongly suggested to industry leaders that the eventual findings would be favorable to them. Whoops! The study was eventually scrapped following public outcry and astonishment.
This is why the first rule of Data Club is “always know where your data comes from.” However I do feel reasonably confident about these particular figures. They come from the agency’s staid surveillance reports, which have been produced every year for approximately forever using the same methodology. They’re the kind of boring, reliable government data that makes up the empirical backbone of thousands of academic papers every year. These numbers have been vetted, time and time again.
Another fun caveat: the NIAAA calculates per-capita consumption figures for Americans over the age of 13. But not all of those Americans drink! A little over one third are total abstainers in any given year, according to different federal data. That means that if you consider only the population of drinkers, the per-drinker annual consumption is something closer to 770 drinks per year, or over two per day. Bear in mind, also, that most of those drinks are actually being consumed by the people in the top 10 or 20 percent of drinkers, who consume literally mind-blowing amounts of the stuff. The alcohol industry relies on alcoholism to survive.
Finally: while full comparable data for 2020 aren’t ready yet, by all accounts it looks like the pandemic (and the Trump administration’s shambolic response to it) drove a lot of Americans to the bottle (again: late capitalism, despair). Early, comparable data for a handful of states suggest an annual increase in consumption of maybe, I dunno, 10 percent? Which would make for quite an impressive spike in that chart at the top of this newsletter, which has typically risen at a rate of less than one percent per annum in recent years.
Full disclosure: I drink! I consumed one Coors Light and approximately 1.5 shots’ worth of Tito’s Vodka in the course of writing this piece. My own feelings about alcohol are *highly conflicted.* It’s easily the least-healthy thing I do to myself, but dang it’s also fun and a nice way to relax sometimes. The industry sucks, but on the other hand do I want to have to learn how to distill my own liquor, and in all likelihood screw something up and go blind? No.
Still, the alcohol situation is one reason why I’m hopeful about the ongoing trend toward legal marijuana (note to Minnesota senators: please get your shit together). While weed carries risks of its own and we may end up discovering more problems with it down the line, at this point it really does seem, on balance, to be less bad for you than alcohol, all things considered (especially if you don’t smoke it!).
And that’s your Why Axis for today! On Monday, I’ll be highlighting some eye-opening numbers on Big Man Syndrome and the ongoing threat of Republican authoritarianism. I guarantee you won’t want to miss it.
If you enjoyed this, I invite you to share it with people you know. If you hated it, I invite you to become a paid subscriber so you can yell at me in the comments. And if you’re not yet a subscriber, what are you waiting for?
Oh, also: a huge, huge Minnesota thank-you to everyone who subscribed yesterday, especially those of you who took the leap of faith of a paid subscription. I will inevitably disappoint you, but I will do my best to postpone that day as long as possible.
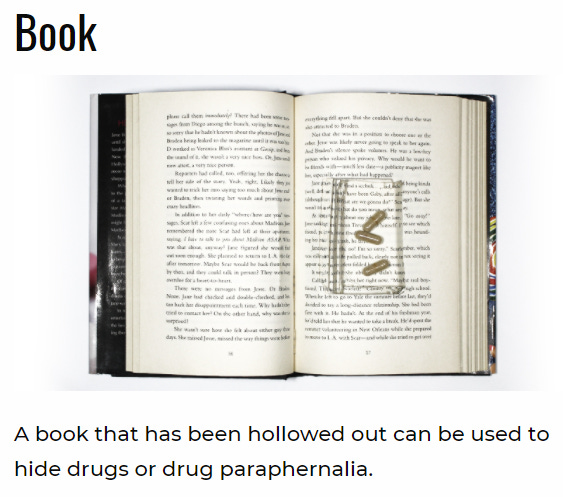
Ah wait one more thing, you guys have to see this: yesterday a St. Louis news anchor became Twitter’s Main Character for a fear-mongering Tweet about all the places to hide drugs in “a normal teen’s bedroom,” which actually ended up being a staged office at the local DEA headquarters.
Last night I discovered that the group staging the “bedroom,” called Addiction Is Real, has a *virtual* version of the exhibit you can explore online! There, you can find out which seemingly innocuous items in your kid’s room are actually Signs Of Drug Use, including:
flip-flops: “a slit cut in the sole” can be used to “hide drugs or drug paraphernalia.”
bras: “the underwire sections” can be used to “slide in pills or stash drugs.”
pens: “can be used to snort drugs and/or to smoke heroin.”
highlighters: “can be used as an inhalant”
Finally, I regret to inform you that books are a gateway: not to adventure, but to Drugs.
Happy Friday!