
Data doesn't have to be mean
Data doesn't have to be mean
Frankly, it should more often be median

It is Monday, August 23rd, a scant 100 days until the start of meteorological winter, and I am back from my journey to the wilds of upstate New York. I logged on to Twitter this weekend to find a lot of people mad about a CNBC story claiming that millennials “have an average of $51,300 in personal savings and $63,300 in their retirement accounts.” Many found these figures implausible, to say the least.
There are a couple things going on here that are worth unpacking because they come up over and over again in reporting on economics and anything data-related in general. The first, as many folks on Twitter pointed out, is the question of average (or mean) versus median wealth. Remember these terms from high school or college stats? Mean is the simple average across a given set of numbers — say you’ve got 5 people and you distribute one hundred dollars amongst them randomly. Each person’s dollar amount will be different but the average (or mean) amount per person will be 20 dollars.
Then you’ve got the median, which is the value at the precise middle of the dataset. Take those same five people and line them up so that the guy with the least amount of money is on the left and the guy with the most is on the right. The amount of money held by the guy in the middle — Guy #3 — is the median.
In many cases it doesn’t matter whether you use mean or median, as they’re often close in practice. But there are times when it matters a lot. Let’s take our five guys again but this time we give all $100 to just one of them, while the other four get nothing. The mean doesn’t change! It’s still 20 bucks. The median, however, is now $0, because Guy #3 doesn’t have any money.
“The average guy has 20 bucks” is still a true statement, but it’s not particularly reflective of reality when four dudes have nothing and one is hogging all the cash. “The median guy has no money” is also true, but it does a much better job in this case of describing the situation of the typical guy in our dataset.
In short, when your data is highly skewed in one direction or another — say, in an environment where the richest 10 percent of households own 70 percent or more of a nation’s wealth — the median does a better job of telling you what the typical person’s experience is like. When it comes to wealth, in fact, the gap between the mean and median is massive and growing ever larger. Take a look.
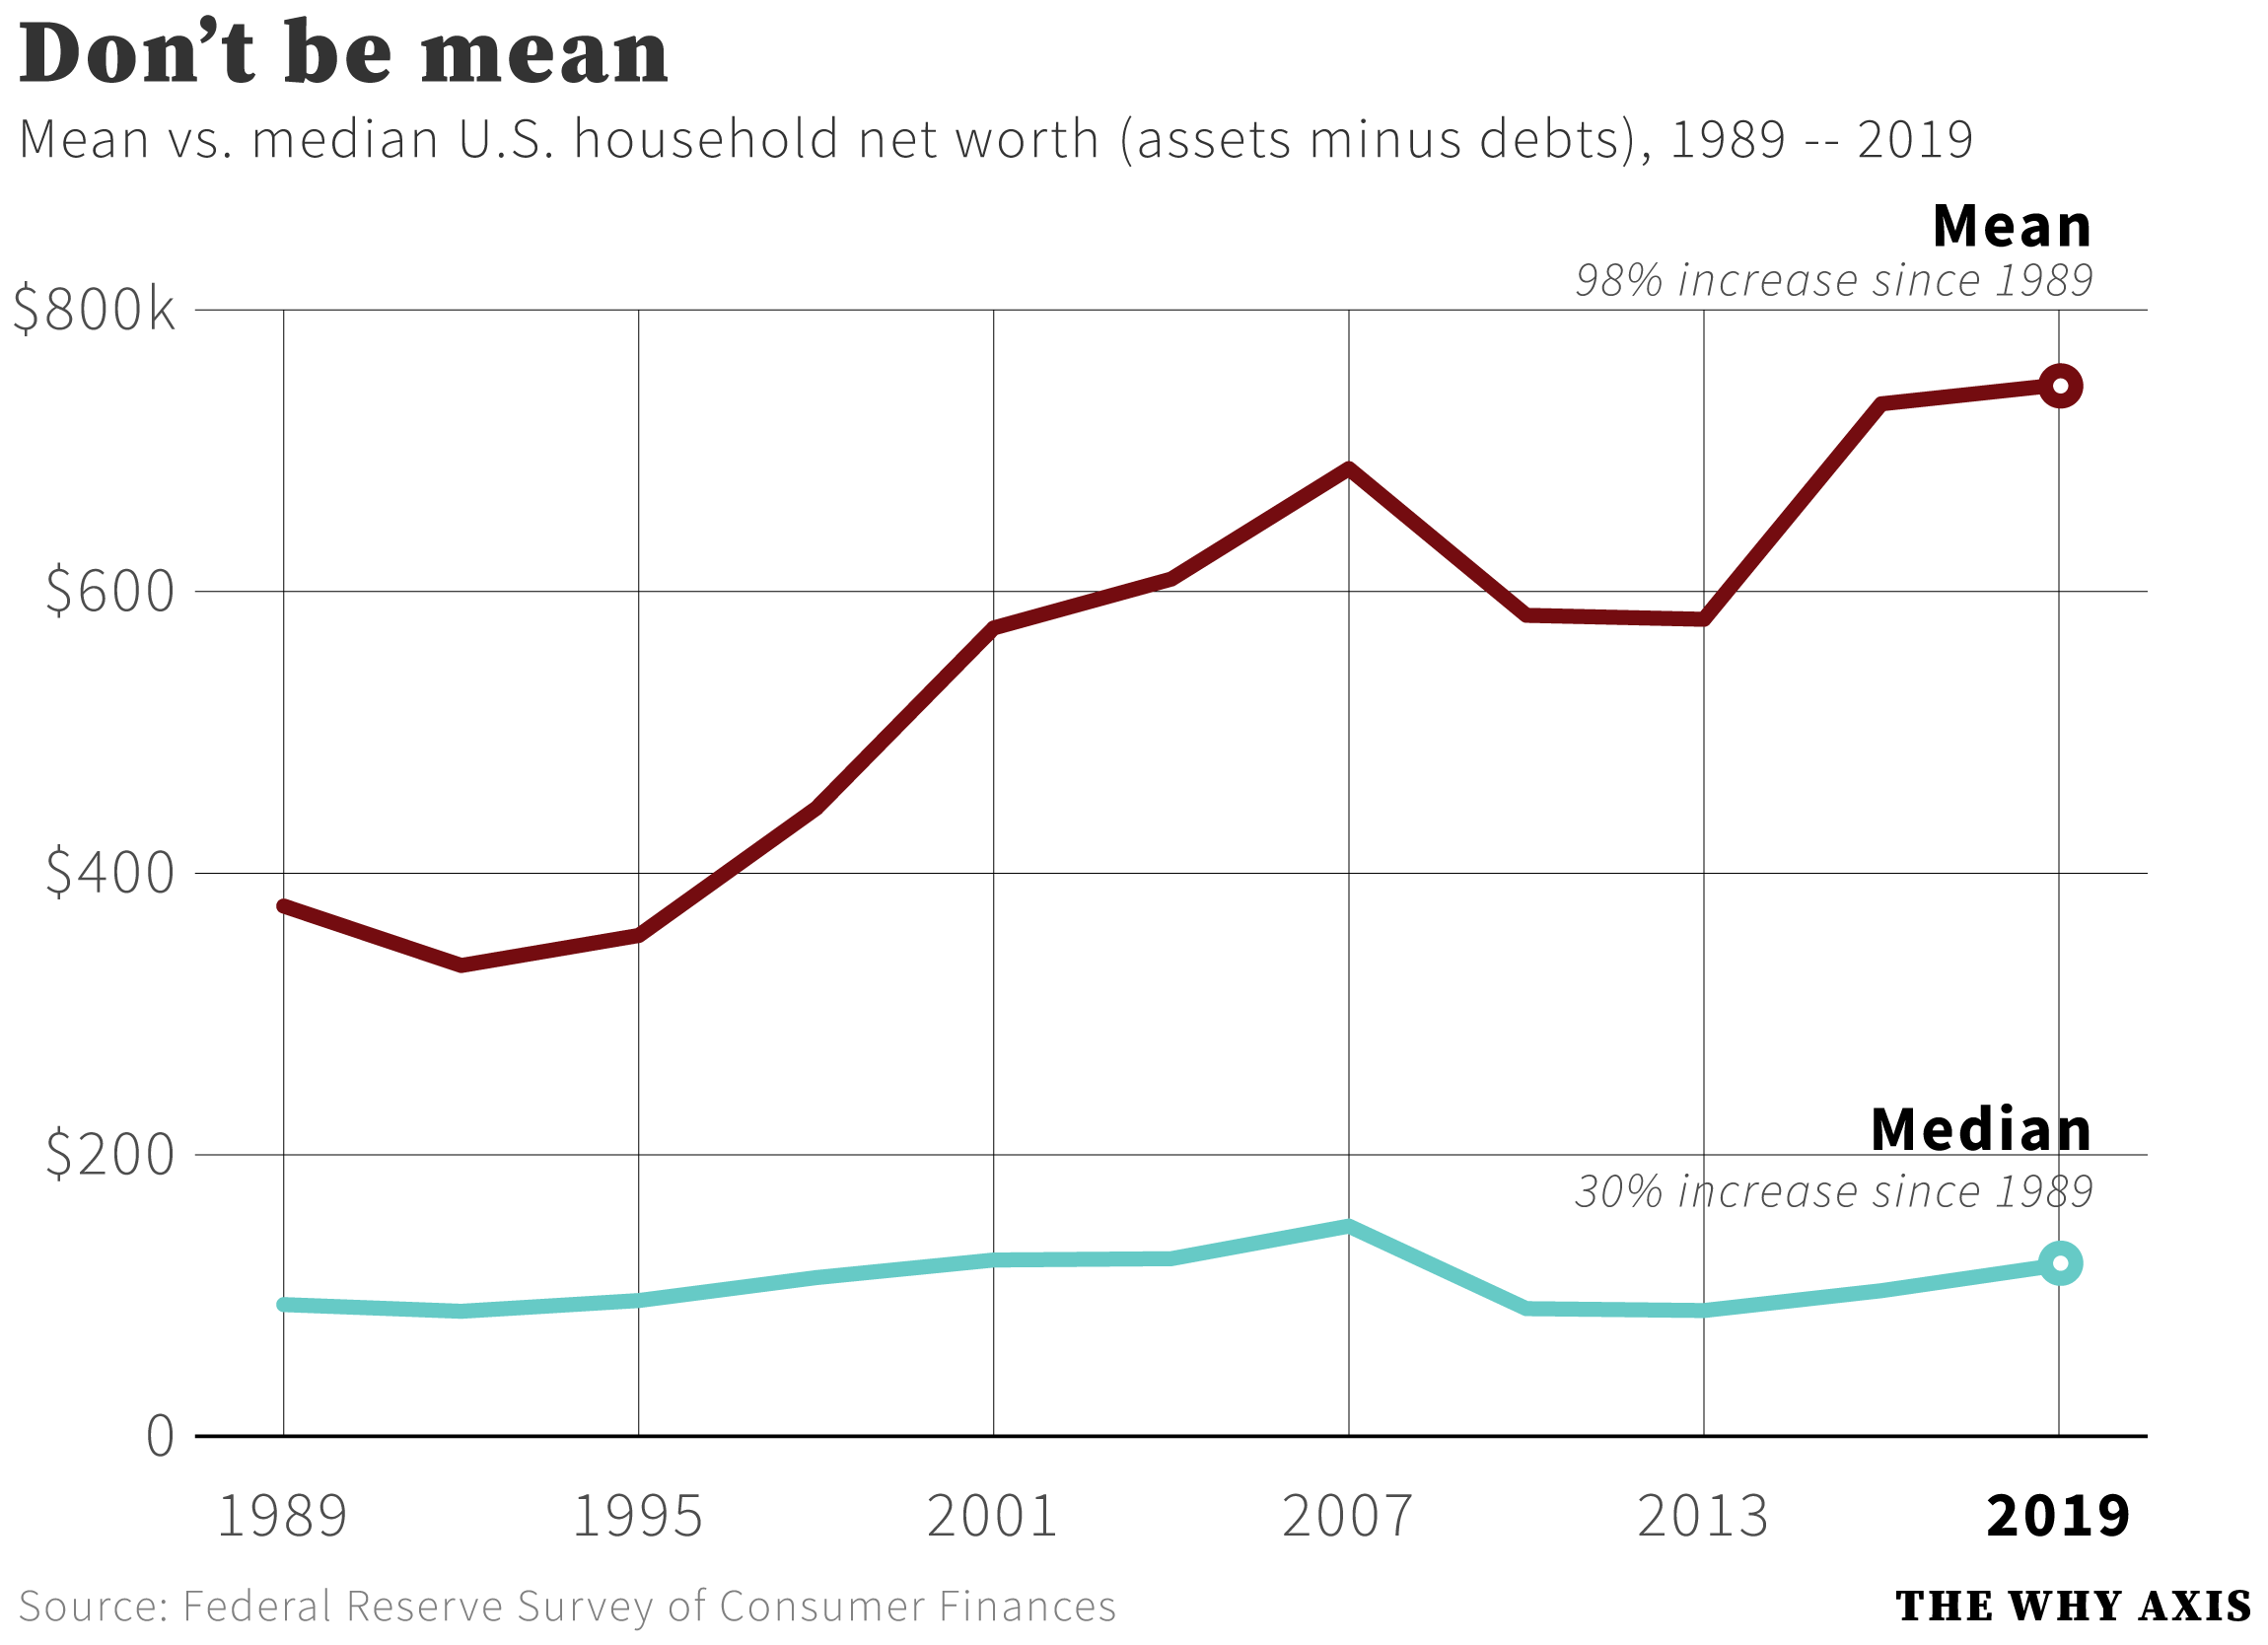
Back in 1989, according to the Federal Reserve’s data, the mean American net worth (about $377,000, in 2019 dollars) was roughly 4 times bigger than the median number ($94,000). By 2019 mean net worth had nearly doubled to $746,000, while the median was up just 30 percent, to $122,000. That rising gap is due solely to the well-documented increase in wealth concentration at the top of the spectrum.
That’s why the CNBC’s decision to report wealth data as averages, or means, was so puzzling. Average millennial wealth is highly skewed by the enormous amounts of money hoarded by the Mark Zuckerbergs and Evan Spiegels and the countless other run-of-the-mill millionaires and billionaires at the top of the American wealth distribution. An average value skewed by those outliers is not going to tell you much about the state of millennial finances.
But there’s a more fundamental problem with the piece, too. The numbers apparently come from a Northwestern Mutual survey of 2,000 people. The company provides scant information about the methodology used in their survey. They don’t report their question wording, for instance, making it impossible to judge whether that wording could have nudged responses in one direction or another. They don’t provide detailed demographic breakdowns, so there’s no telling how nationally representative their sample is. They note that “no estimates of theoretical sampling error can be calculated,” which suggests that this is based on a convenience sample of people who chose to take the survey, meaning it’s probably not at all representative of the national population.
None of this is terribly surprising. Northwestern Mutual is a private financial services firm. Like most private companies their primary reason for existence is to enrich themselves and their investors, and not, say, to provide reliable polling about the state of the economy.
When a private company does a “survey” like this, especially one that’s this methodologically iffy, and especially when they’re releasing the “results” for free, it’s best to think of it as a marketing tool rather than a source of trustworthy information. A financial services firm might, for instance, not be particularly concerned if they come up with inflated wealth numbers that make worried consumers purchase their financial services in the hopes of getting ahead.
Companies do this kind of thing all the time. But there’s no reason the press needs to take the bait — particularly when other, far more reliable data is readily available. According to the Survey of Consumer Finances, for instance, the median American under age 35 has about $13,000 in their retirement accounts, with another couple thousand in various bank accounts (and before you hit me with the “you guys have retirement accounts?” meme, bear in mind that fully half of under-35s have less than that, with a substantial share owning nothing at all). That age group doesn’t map precisely to “millennial,” but it’s a much more accurate number than the well over $100,000 in average millennial savings claimed by the Northwestern survey.